How to access Syke’s datasets with WMS?
The datasets produced by Syke’s Earth Observation are available via a WMS-API. These examples are done with QGIS. Adding the data consists of following steps:
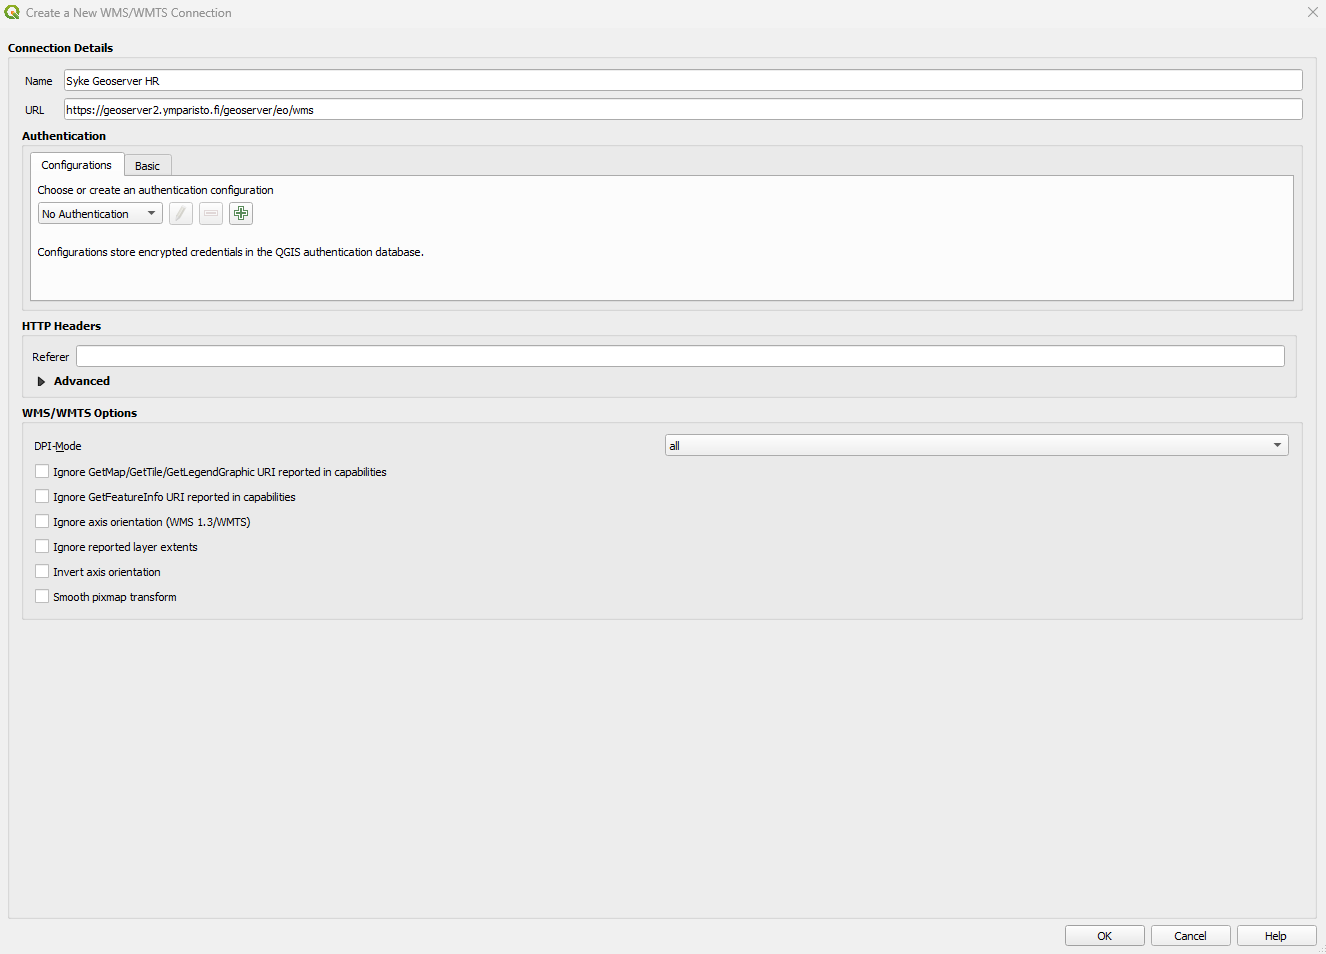
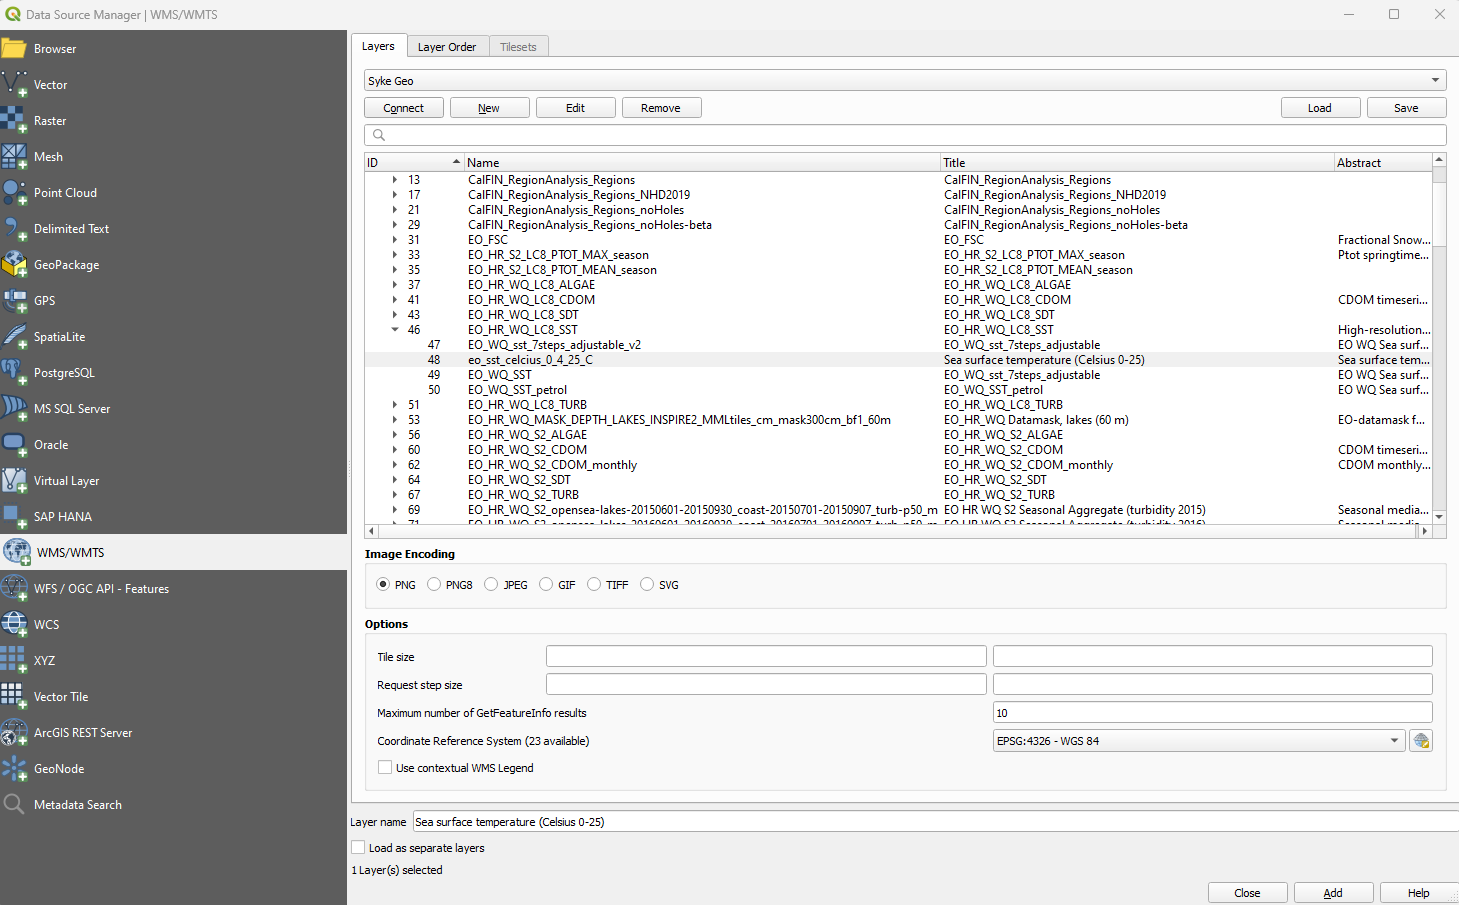
Connecting to the geoserver (WMS)
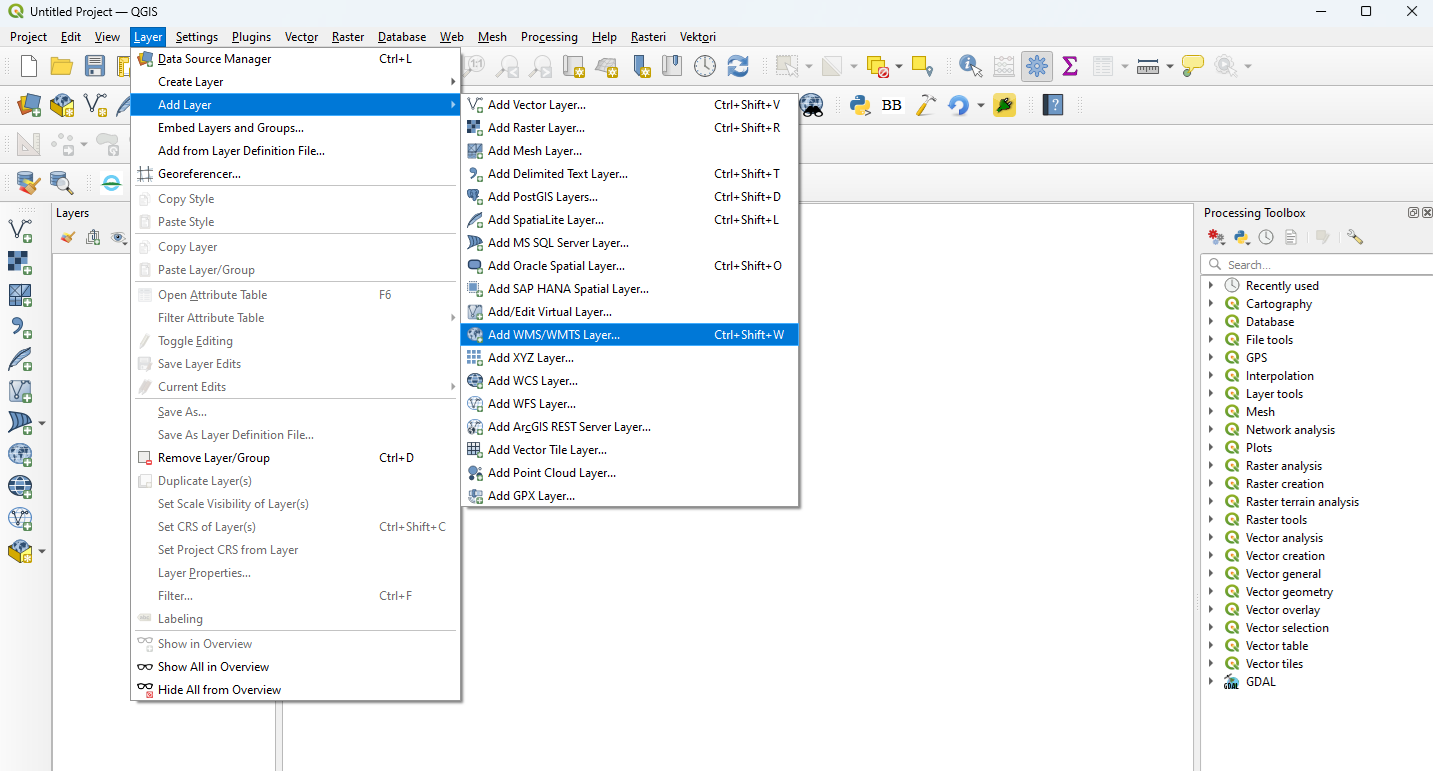
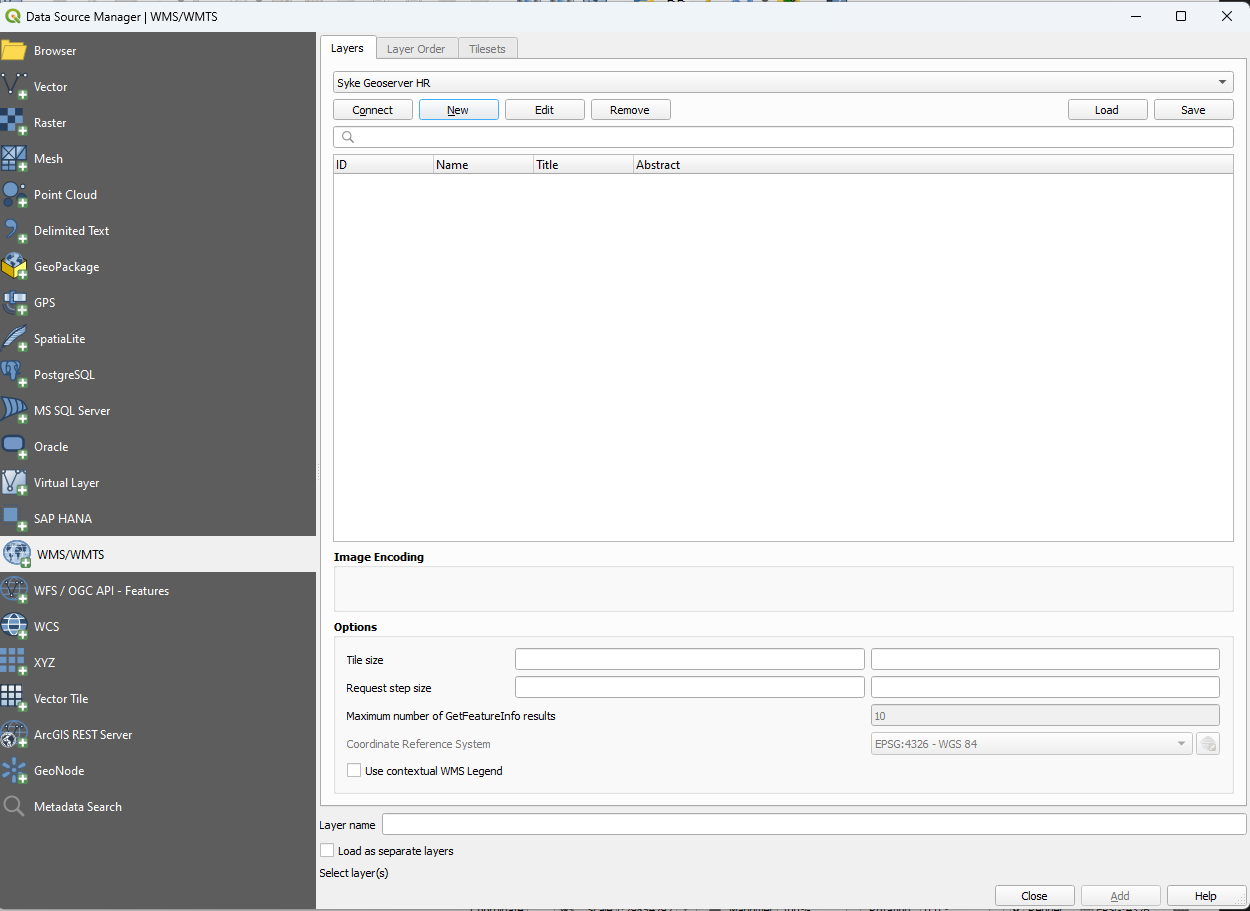
Adding data to the project
There are a lot of datasets available for visualization purposes on Syke’s geoserver for EO material. These datasets are Syke’s interpretations from satellite observations and should be cited according to Syke’s citation policies. For example there are daily interpretations of:
- Sea surface temperature (SST)
- Blue-green algae (ALGAE)
- Turbidity (TURB)
Also there are seasonal aggregates and composites of turbidity, blue-green algae, and chlorophyll-a.
Selecting a date
The date of data visible on the layer in daily interpretation datasets can be configured with the following method:
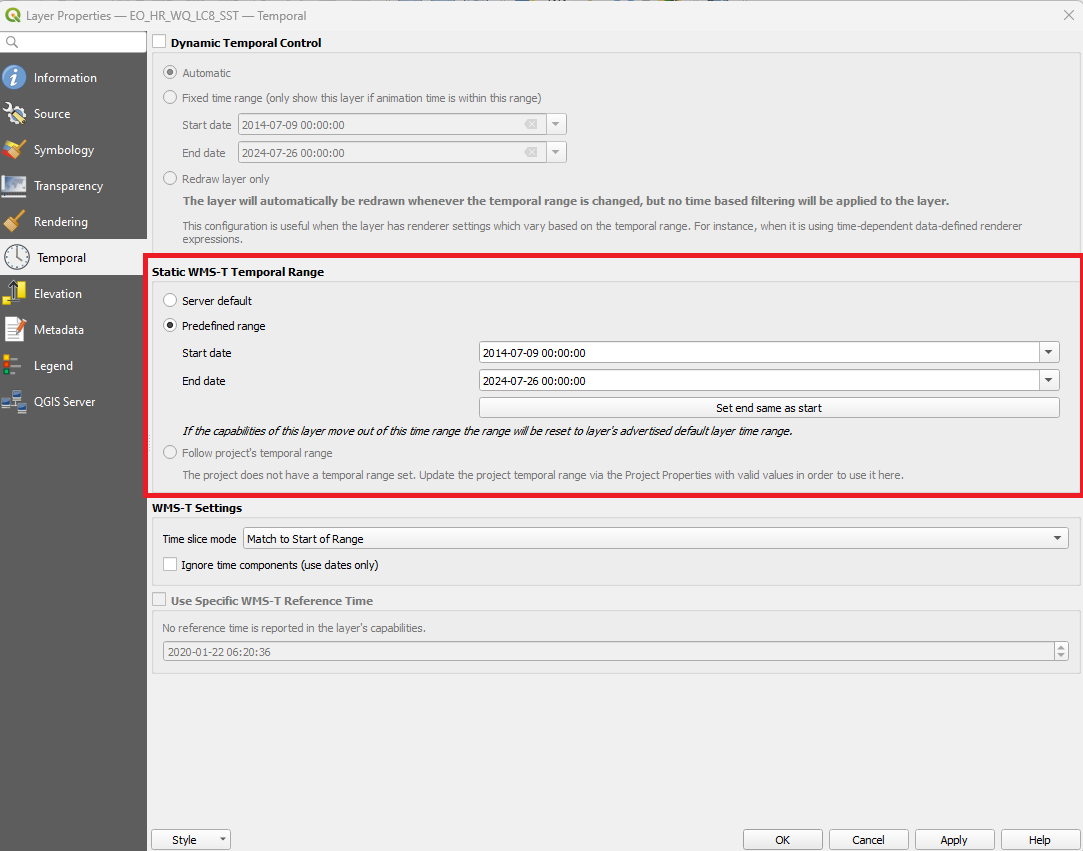
- Double-click the layer to open the layer properties
- Open the “Temporal”-selection
- Untick “Dynamic Temporal Control”
- Modify the date range by choosing the start and end dates
- By default the “Match to Start of Range” option is selected which means the visible layer is from the Start date
- If there is no data visible, try changing the Time slice mode to “Closest Match to Start of Range”
- You can also view multiple satellite interpretations from different days simultaneously by adjusting the “Time slice mode” to “Use Whole Temporal Range”
- If you use the whole temporal range, be sure to select only short period of time (maximum 1–2 weeks) or the Geoserver instance might overload and crash
- By default the “Match to Start of Range” option is selected which means the visible layer is from the Start date
A similar approach can be used with other datasets that support a temporal coverage. The aggregates and composites are limited to a single static view.