Map features
Zooming and panning the view
You can pan the map view from one location to another by clicking on the map with the left mouse button and dragging it in the desired direction.
When you want to examine a specific area on the map more closely or get an overview of a broader geographical region, you can zoom in and out of the map. You can use the mouse scroll or the scroll gesture on a touchpad for this purpose. On mobile devices or touchscreens, use the two-finger pinch gesture. Alternatively, you can click on the plus and minus signs in the top left corner of the map to zoom in and out.  .
.
Sharing the map view
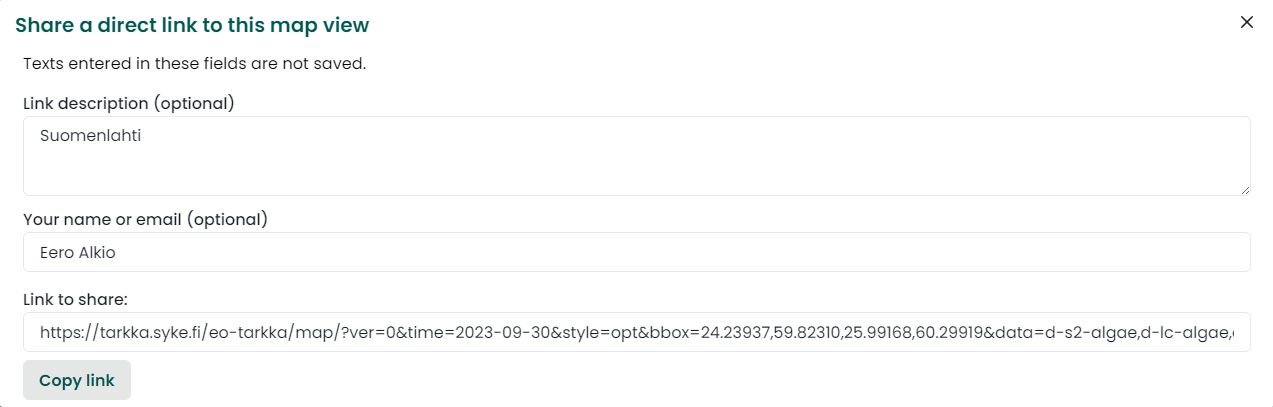
The map view can be shared or saved as a web link. This feature allows you, for example, to create a list of links for interesting observations or areas or share a link to a specific map view with your colleague.
First, focus the map on the location you want to share, and activate the map layers you want to include in the share. From the “Link to current view” ![]() button, you can copy the link to the map view you want to share. In the popup window, you can provide a title, a brief description, and your name or email address for the link. This information is not stored anywhere; it travels encoded in the link’s web address.
button, you can copy the link to the map view you want to share. In the popup window, you can provide a title, a brief description, and your name or email address for the link. This information is not stored anywhere; it travels encoded in the link’s web address.
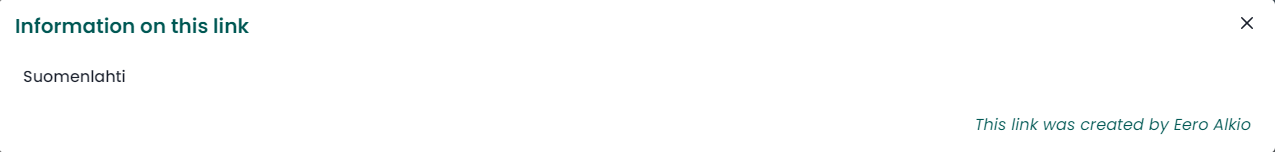
The web-links of Tarkka map view look like this:
https://tarkka.syke.fi/eo-tarkka/map/?ver=0&time=2023-12-19&style=opt&bbox=17.76429,60.08541,37.09271,64.93068&data=d-s2-algae,d-lc-algae,d-s3-algae,d-s2,d-lc,d-s3,d-bm-esri&coll=calgae&lang=en When the shared link is opened, Tarkka loads the datasets mentioned in the link into the EO map browser, and the text entered by the sharer appears in a window that looks like this:
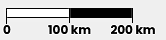
Map scale
The scale bar is located at the bottom of the map. It adjusts its size as the map is zoomed in or out.
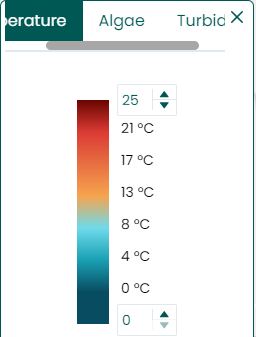
Map legend
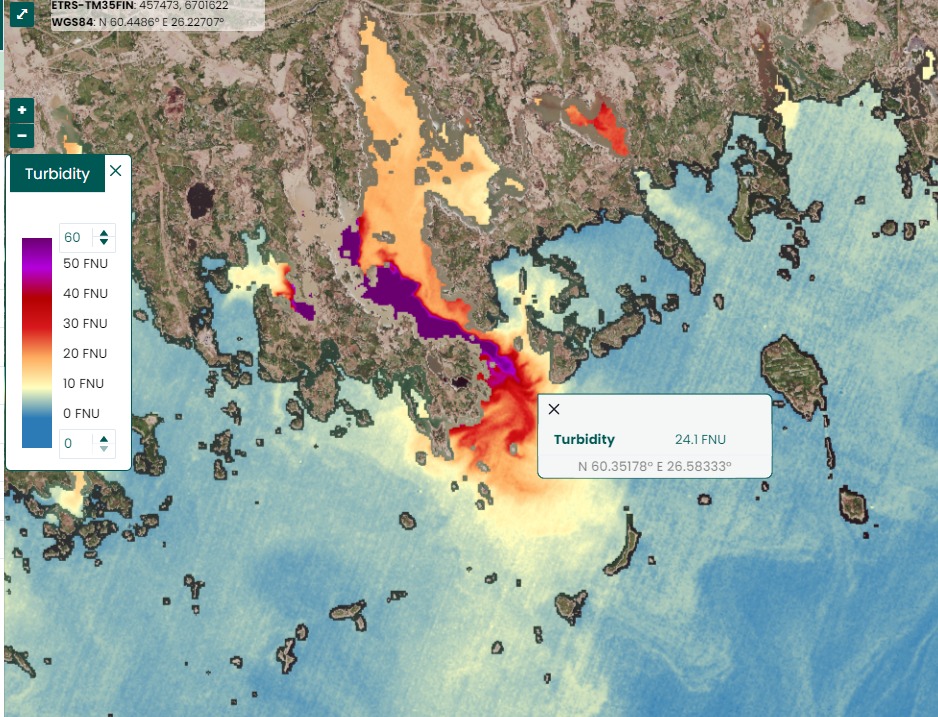
The color legend for datasets is found in the color bar on the left side of the map interface. You can customize the upper and lower limit values by entering the desired values into the legend’s text fields and pressing the Enter key or click outside legend to apply the changes.
Legends and color maps can be moved within the application window by dragging with the mouse. You can close the legend with a click on the ‘x’, and reopen it from the button on the right side of the map window 
Inspecting the observation values and object information
To view the value of an observation, click on the map with the left mouse button. This action opens a pop-up window displaying observations from the active datasets. The geographical coordinates of the clicked point are displayed at the top of the pop-up window.
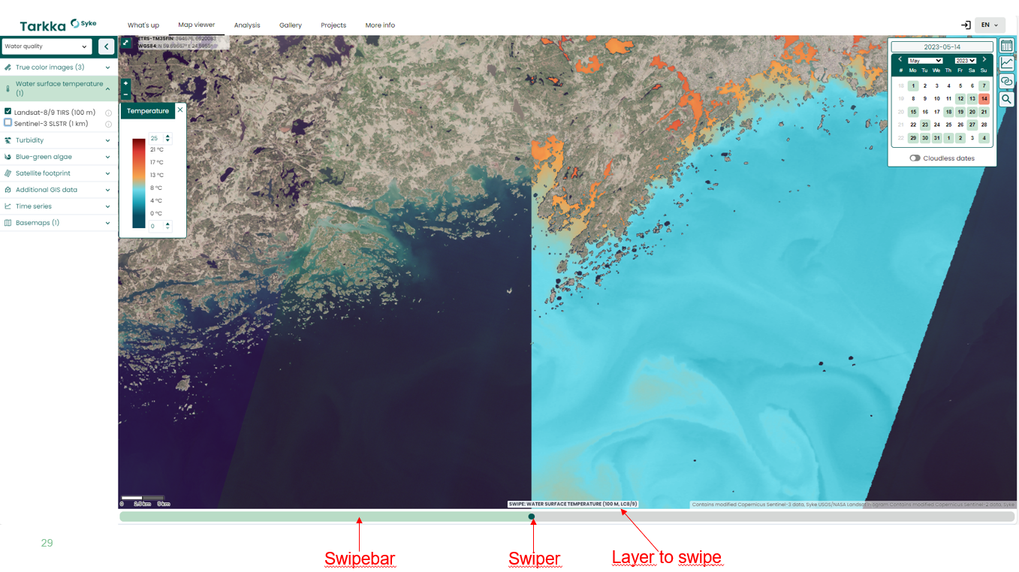
Swipe functionality
Below the map, there is a swipe bar that allows you to “peek” beneath the topmost active map layer. The swipe function is used by dragging the mouse across the swipe bar’s ball icon or swipe handle from left to right. This way, you can limit the view of the topmost map layer to only the right side of the swipe handle. Other active layers are visible normally to the left of the swipe handle. Hovering the mouse cursor over the swipe bar displays the name of the map layer affected by the swipe function.