Gallery
General information about the Gallery
The gallery includes Tarkka observations from selected areas of special monitoring as image time series. Images can be filtered based on the area, year, and cloud cover percentage. The images can be freely used as long as the license information are mentioned.
Tarkka’s Gallery accumulates satellite observations for the current year, and observations from previous years are also available for browsing. The gallery now includes over 50 lakes and over 10 coastal areas. Suggestions for additions to these target areas can be proposed: eotuki@syke.fi. If the area of interest is missing from the selection options, interesting observations can also be searched for in the Map viewer tab (found in the magnifying glass on the right side, under Location search). The search works by names and water body codes. The Cloudless days search function from the calendar menu can be used to find good cloud-free true color observations.
Gallery instructions
Special monitoring region selection: In the Gallery, you can choose the region to be examined by selecting it from the drop-down menu of regions (Figure 1) You can see the region in the overview map on the right top corner. The overview map view can also be zoomed and scrolled. You can also search for a region by typing its name in the drop-down field.
Region selection from the Map viewer: Select the desired dataset in the Map viewer (e.g. true color images, water surface temperature, composite datasets) and a dataset from the “Gallery regions” group (e.g. WFD water bodies – lake and/or coast). Then select the desired region (for example, a lake) from the map. A popup window will open (Figure 2), containing a link labeled “Show in Gallery.” Clicking this link will open the images of the selected region in the Gallery.
Selection of the cloud cover percentage: Clouds visible in the images can prevent the desired observation from being seen, so the interface allows varying the maximum allowed cloudiness of the images. The default cloudiness value for the images is 25%. You can adjust cloudliness value from the “Filters” menu in the left between 5% to 50% (Figure 1). By setting the allowed cloudiness to its lowest value (5%), the images are clear, but there are fewer of them compared to allowing more cloudiness.
Year/month selection: Users can select the year(s) and month(s) for the images displayed in the “Filters” menu (Figure 1).
Image order: The display order and grouping of images can be adjusted using the options in the “Order” section (Figure 1). Images can be shown either with the newest first or the oldest first.
Hiding images: If an image is not very representative, or contains clouds or similar issues, it can be hidden from view using the “Hide images” function (Figures 1 & 3).
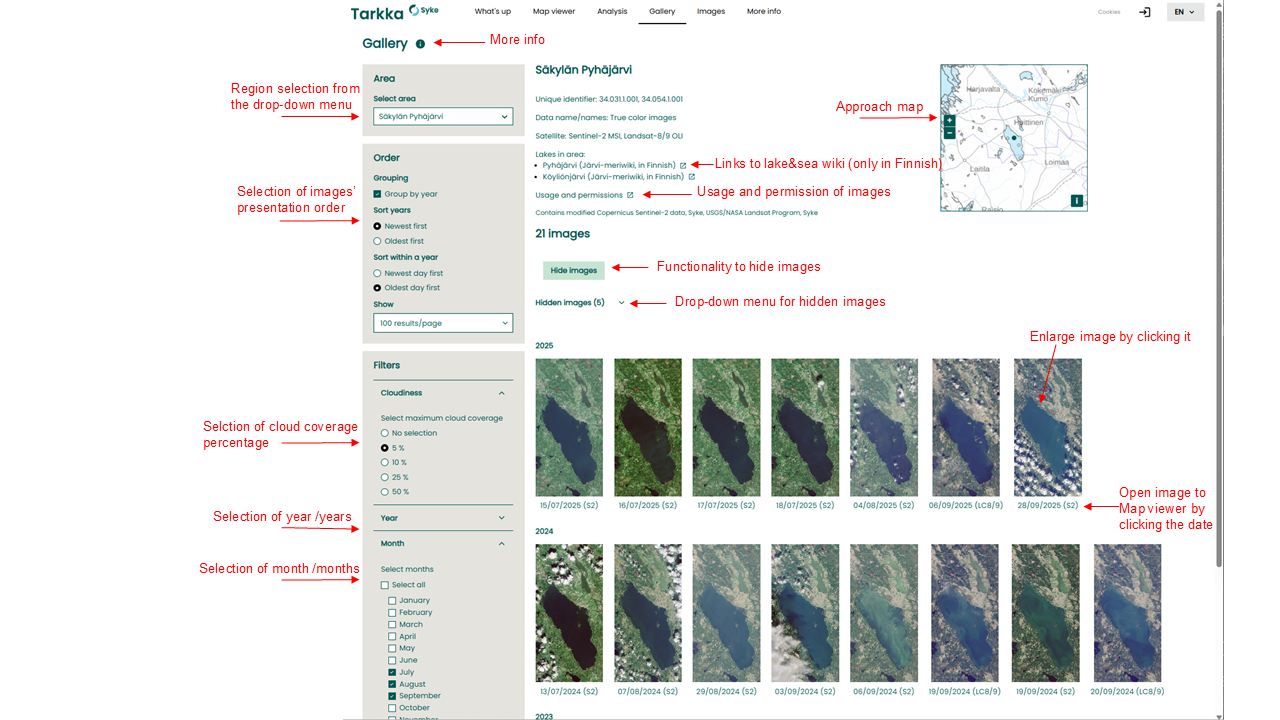 Figure 1. Basic functionalities of the Gallery
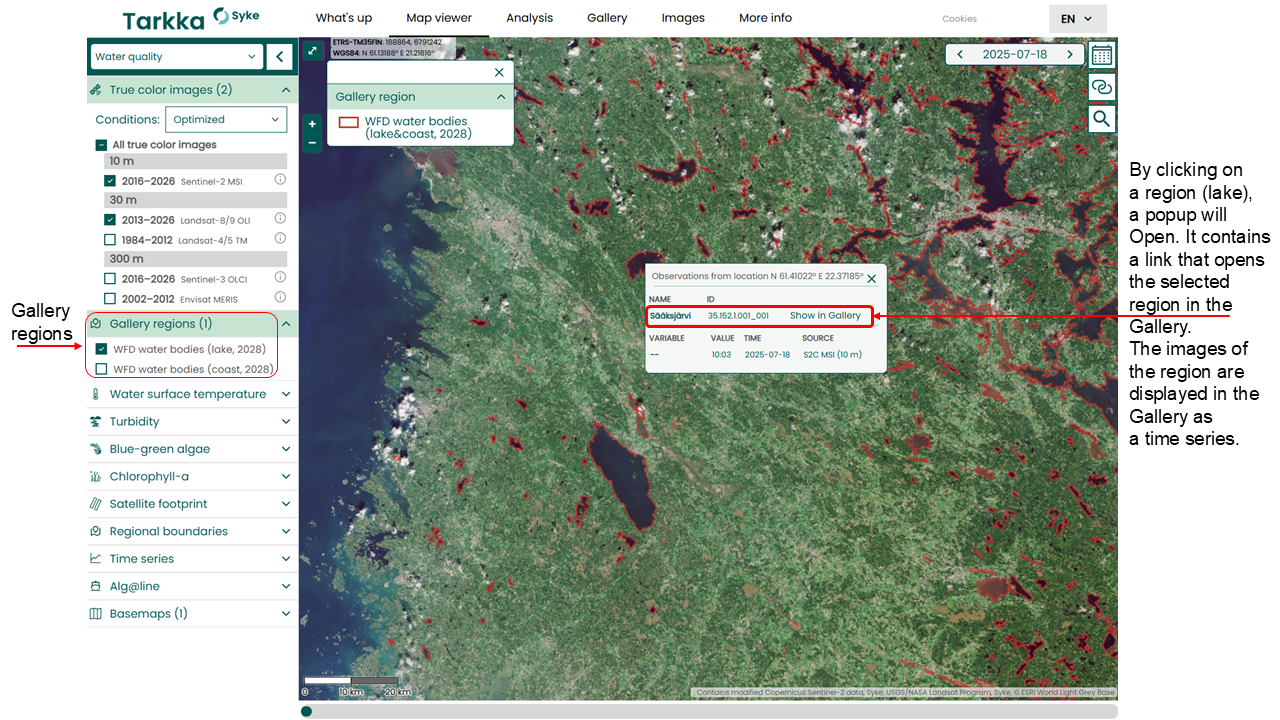 Figure 2. Region selection from the Map viewer
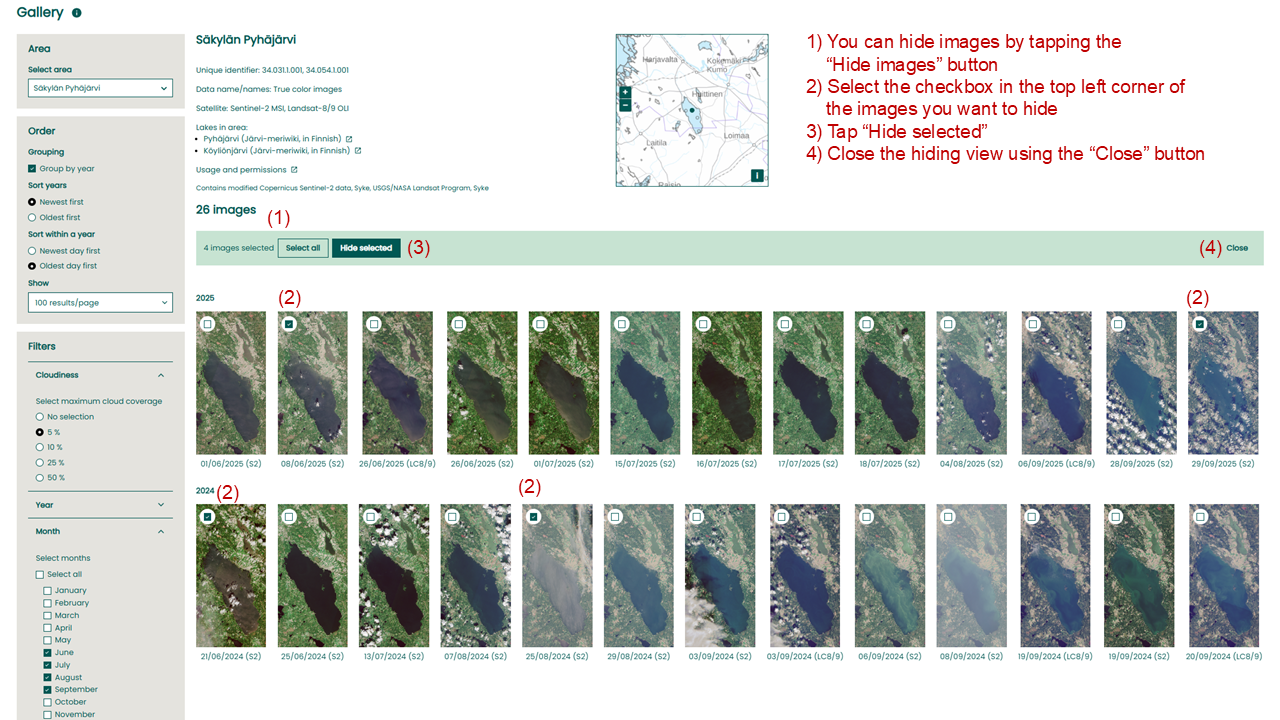 Figure 3. Hiding non-representative images from the view.